Expanding from STRIDE, Stanford Translational Research Integrated Database Environment to StaRR, Stanford Medicine Research Data Repository
Research IT team has managed STRIDE Data Warehouse since inception. The scope of the data entering the warehouse has expanded well beyond the initial STRIDE vision and capabilties.
To capture the new types of biomedical Big Data in the data warehouse, Research IT is designing the next generation data warehouse to support petascale data to support radiology PACS, pathology slides, genomics, biobank, mhealth and other sources. We are leveraging cloud technologies to support the scale.
The overall vision for the STARR data warehouse is represented in the figure below.

Exploring data in STARR
At the core of Stanford Medicine Research Data Repository (STARR) clinical data warehouse is the Electronic Medical Record (EMR) data going back to 1998. This clinical data warehouse contains data from both hospitals and spans multiple EMR implementations: Epic Clarity at Stanford Hospitals and Clinics (SHC) since 2005, Epic Clarity at Stanford Children's Health (SCH) since 2015, Cerner at SCH 2005-2014, and CareCast and LastWord at both SHC and SCH prior to 2005.
Reimbursement codes, also known as billing codes, are one of the more commonly utilized sources of structured data in EMRs. The STARR record of diagnosis and procedure codes over time shown in graph below reflects the conversion from paper to electronic records in the 1990s through early 2000s, followed by a steady rate of growth in patients served by the system, starting around 2010.

The above graph shows the number of distinct patients each year with diagnosis or procedure codes since 1998.
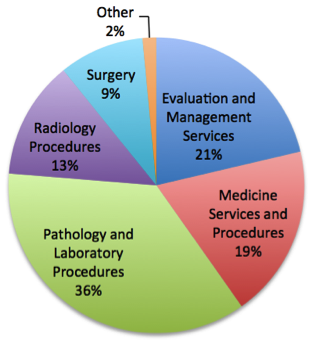
The pie chart on the right shows the breakdown of procedure codes for the year 2016. Roughly half the procedures coded in 2016 pertained to diagnostics such as radiology, pathology and labs. Slightly less than 10% of all procedures coded were classified as surgical, the remaining 40% split roughly evenly between non-surgical intervention and disease management.
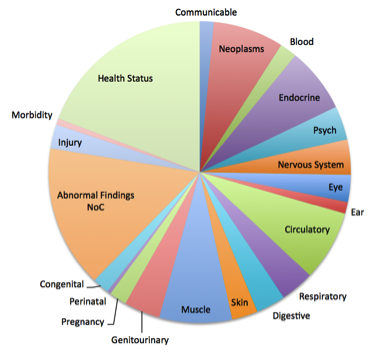
Diagnoses coded in 2016 are shown in the pie chart below. These are fairly evenly distributed across the high level clinical categories, indicative of the broad spectrum of health care specialty services offered at Stanford.
The graph below depicts the number of distinct patients each year since 1998 by encounter type - Inpatient, Outpatient, Emergency, and Surgery.

The steady outpacing of hospital related encounters by outpatient visits reflects the recent transition at Stanford from a focus on tertiary and emergency care services through 2010, to the shift in recent years toward outpatient care. This trend will only accelerate as Stanford continues extends its reach into the community care setting through the University Healthcare Alliance and Packard Childrens’ Healthcare Alliance.
The graph below depicts the number of distinct patients with at least one pharmacy order / lab result in the given year.

As you can see, in 2008 there was a distinct shift from paper prescriptions to electronic medication orders that coincided with the migration from CareCast/LastWord to Epic at SHC. By contrast the transition from paper to electronic records for lab results took place at Stanford in the late 1990s and was complete by the turn of the millenium. It is also interesting that in 2014 the rate of medication ordering started to outpace the record of lab results, indicative of a steadily increasing population of patients receiving their primary care in an outpatient setting.
Finally, the graph below shows the number of distinct patients each year since 1998 for which the data warehouse has associated narrative documentation: clinical notes, and radiology and pathology reports.

Again here we clearly see evidence of the growth into outpatient services in recent years, reflected by the growth in number of patients with clinic visit notes as compared to the more measured growth rate for diagnostic (radiology and pathology) reports.
Stanford Medicine launches exome sequencing program for patients

The Clinical Genomics Program, which began as a pilot program a few years ago, went into production in Mar 2018. The program offers whole-exome sequencing and analysis to patients with undiagnosed genetic diseases.